Much has been made of Chairman Powell’s recent pivot towards normalizing monetary policy, accelerating the taper of QE, and subsequent “lift-off” from the zero-bound Fed Funds rate. The market has begun to reprice expectations for short-to-intermediate rates and the yield curve has steepened accordingly. Traditionally, steeper yield curves favor margin managers, as the spread between funding costs and earning asset yields widens while depositories have historically succeeded in lagging the Fed’s rate hikes. As we look forward into 2022, market participants are pricing in 4 or more Fed rate hikes, we thought it prudent to revisit considerations for deposit pricing for a rising rate environment. In this eBrief, we will discuss macroeconomic trends amongst community financial institutions, historical deposit pricing behavior, and factors to monitor as your ALCO looks for direction in pricing.
First and foremost, we must take a step back to assess the impact to financial institutions from the pandemic and related monetary and fiscal policy largess. Today, we sit at an unprecedented level of liquidity in the financial system, whether measured by traditional metrics such as M1/M2 or a high-level review of community institutions’ asset mix trends (see Table 1).
Earning Asset Mix Trends for Institutions <$10B
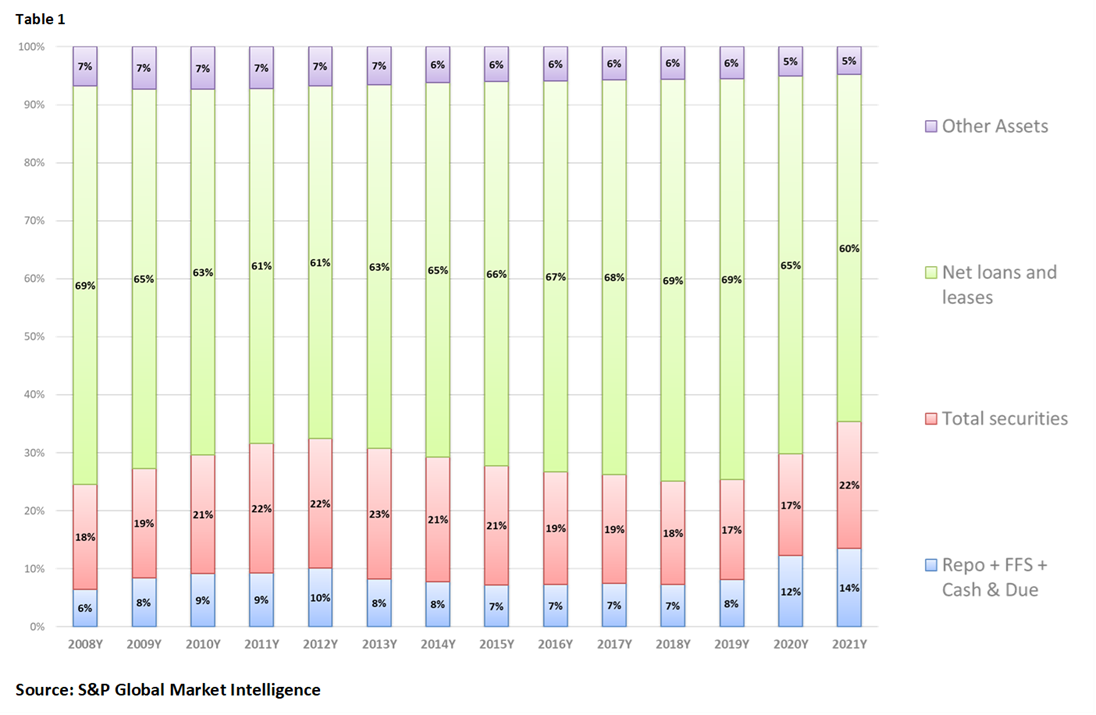
For simplicity purposes, in Table 1, we’ll consider cash, cash equivalents, and securities as a measure of overall liquidity. As we look back through the last 13 years, on balance sheet liquidity has never been higher. Loan paydowns, loan forgiveness, secondary market cannibalization, combined have made a dent to loans’ share of the asset mix. Stimulus has fortified consumer and business deposit balances, reducing demand for loans, magnifying net interest margin compression. The buildup in liquidity has been fast and fierce since the onset of the pandemic. Looking back at the prior recession, it took about 6 years to lend out excess liquidity. All economic cycles are different, but with the sheer volume of liquidity today, deposit pricing competition is likely to remain subdued over the coming quarters.
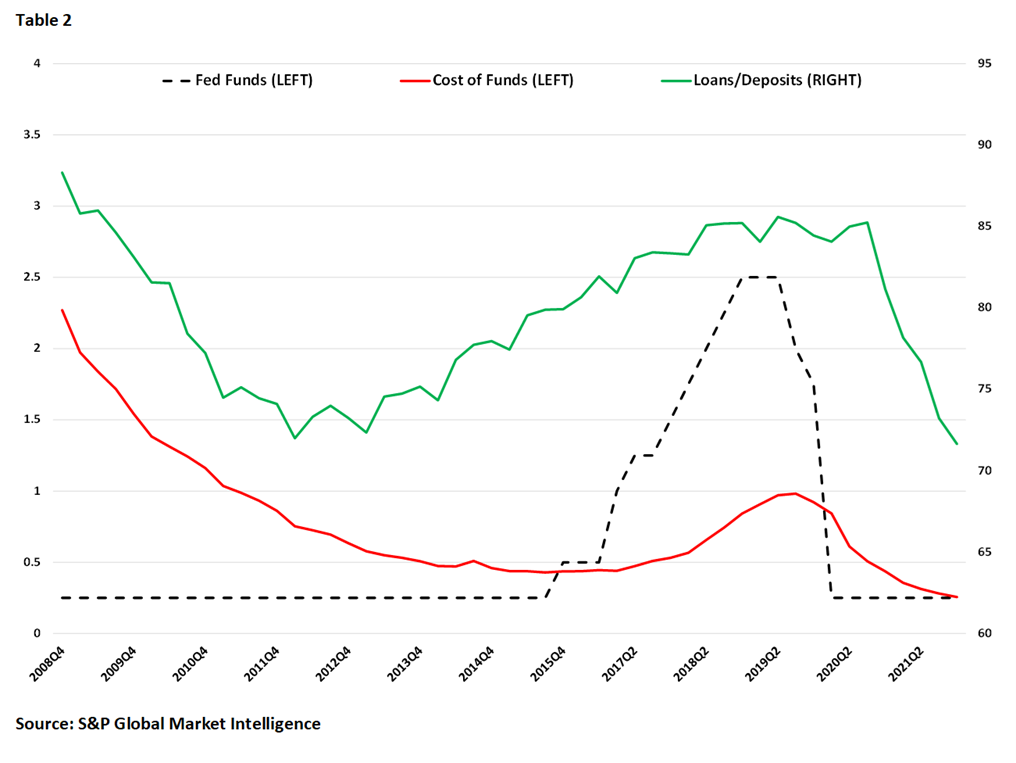
As we have written in the past, loan to deposit ratios can tell us a lot about the overall state of balance sheets and deposit pricing environment. Table 2 below includes data from the prior rising rate cycle. Interestingly, loan to deposit ratios and cost of funds are positively correlated; however, note the lag between when loan to deposit ratios started to rise (2013), when the Fed began raising rates (2015), and, finally, when cost of funds’ acceleration began in earnest (2018).
Funding Costs and Loan/Deposit Trends for Institutions <$10B
This lag is notable for a number of reasons, primarily related to the balance sheet mix trends in Table 1. As economies and loan demand begin to recover from a recession, funding of net new loan demand is generally met via the following hierarchy:
- Early cycle, loan growth is generally self-funded via excess/idle cash on balance sheet
- Investment cash flow can be utilized to minimize pressure on capital ratios
- Wholesale funding can be tapped to minimize marginal cost of funds impact
- Late cycle, deposit competition accelerates as all alternative liquidity levers have been pulled
This thesis can further be supported when analyzing how deposit betas accelerate throughout the course of rising rate cycles. As we have talked before, deposit pricing does not have a static relationship to Fed Funds or other key driver rates. Rather, deposit pricing competition and betas are dynamic and accelerate throughout the cycle as driven by capacity to fund the highest earning asset opportunity – loans. Table 3 includes a review of the prior rising rate cycle broken down by 75bp increments.
Commercial Bank Deposit Beta Trends
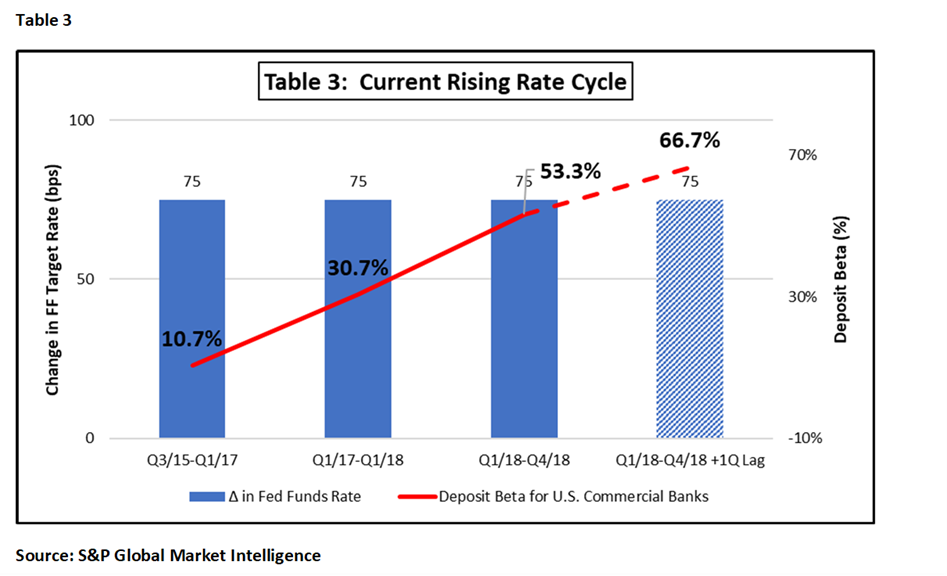
Notice the contrast between beginning and end of cycle deposit betas and remember this as we anticipate early cycle rate movements on the near-term horizon.
Taylor Advisors’ Take:
“Study the past, monitor the present and prepare for the future” is a mantra at Taylor Advisors and one we believe will suit ALCOs well as we navigate an evolving interest rate regime. With PPP fee income recognition wrapping up and secondary market volumes normalizing to an extent, profitability for 2022 and beyond will become more dependent up NIM. Deposit pricing will be an important piece of the equation as banks work through excess liquidity. In addition to your institution’s specific liquidity profile, be sure to monitor the following:
- Deposit pricing from the prior rate hiking cycle and any lessons learned from successes or missteps
- Consumer and business accounts behavior and any trends in drawdowns or spending of savings
- Non-traditional depositories’ rates and any migration of your deposit base to these platforms (i.e. fintech, SOFI, Marcus, money market mutual funds, state sponsored public deposit funds)
- Loan to deposit ratios and trends amongst your in-market competition
Remember, pricing of deposits is similar to other goods and services in that any imbalances in supply/demand dynamics will drive pricing. Today, liquidity and deposits are in ample supply relative to loans. While history does not always repeat itself, it can be a helpful guide if you take the time to study and learn from it.
Taylor Advisors’ helps executives by providing strategies and expertise to effectively manage the balance sheet and Net Interest Margin. Please visit out website for additional publications or to ask us a question about your balance sheet process and how we can help.
You have already subscribed to distributions. Thank you for your interest in our publications!