Over the past year, financial institutions across the country have seen an acceleration in funding costs. Historically, institutions have been successful in delaying rate increases on deposits during the initial stage of the rate cycle, then slowly increasing deposit rates for the second third of the cycle. From late 2015 through 2017, institutions enjoyed the benefit of margin expansion and relatively stable, low funding costs. During this time, depositories generally used a combination of investment portfolio roll-off and organic deposit growth to fund loans while strategically using wholesale funding as an alternative to meaningfully raising in-market deposit rates.
The most recent 75 basis point increase in the Fed Funds rate tells a different story than the previous 150 basis points. History tells us it is the final stage of rate hiking cycles when funding cost pressure builds to the point of material deposit beta acceleration. As institutions continue to compete for loan demand, wholesale funding has grown in use and many depositories find themselves closing in on internal policy limits for non-core funding sources. At the same time, institutions have focused on more organic funding growth by competing locally for deposits. Competitive pressures have pushed institutions to offer higher-priced time deposits and non-maturity deposit products that often times are priced close to wholesale funding rates. When this happens, funding costs accelerate significantly as these new products and specials can cannibalize existing lower cost deposits and meaningfully increase marginal funding costs. Exhibit 1 provides data for U.S. Commercial Banks showing the 2004-2006 rising interest rate cycle, broken down by thirds and including a four-quarter lag for the final 150 basis points, and the respective deposit betas for interest bearing deposits:
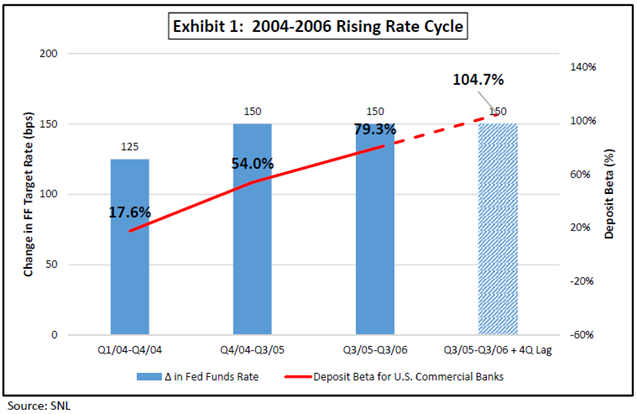
As depicted in Exhibit 1, deposit betas tend to be dynamic in nature and accelerate as monetary policy tightens. An interesting aspect of the 2004-2006 rising rate cycle is that even though the Federal Reserve kept rates steady for four quarters after its final hike in June 2006, funding costs continued to accelerate as deposits repriced upward and banks continued to compete to fund loan demand. This is depicted by the bar on the far right which shows that betas increased by 25.4% (104.7% versus 79.3%) with no additional increase in the Fed Funds rate, amounting to a 38 basis point increase in funding costs (25.4% x 150 bps).
At the March 2019 FOMC meeting, the Federal Reserve softened its stance on future rate increases and revised the Dot Plot forecast downward, removing expectations for future rate hikes. The market’s expectations for the path of interest rates have changed as well. Exhibit 2 illustrates the market’s shifting sentiment during 2019 in the implied probability for interest rate hikes versus cuts, as expressed in the Fed Funds futures market.
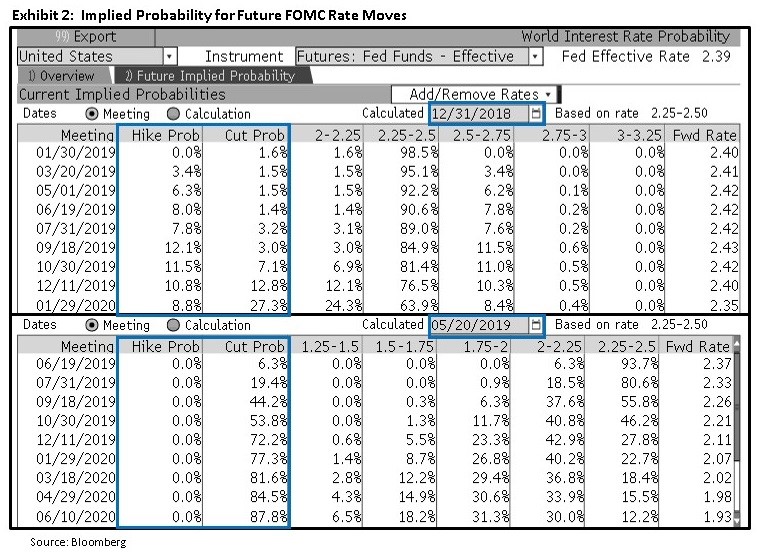
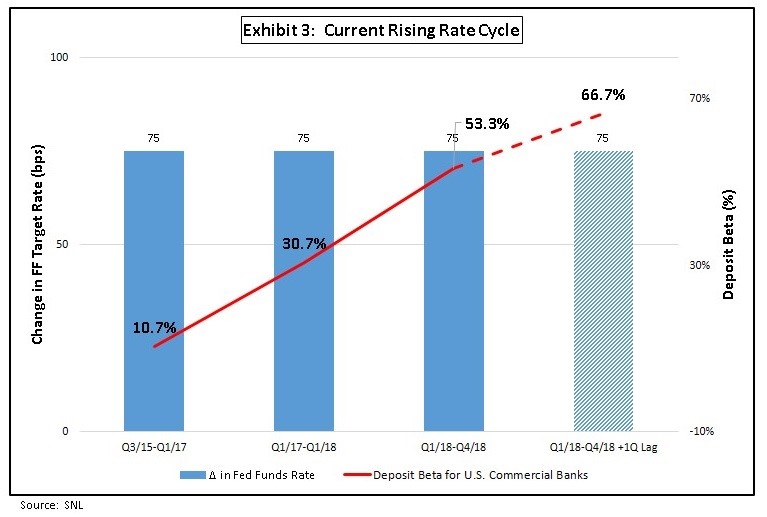
While the Fed Funds futures market is fluid and changing daily, we cannot overlook the importance of the signals the market is sending. We could very well be in store for a similar Federal Reserve “pause” before the next rate movement downward based on these observations and current consensus forecasting from economists. Exhibit 3 illustrates deposit betas in the current monetary tightening cycle and shows a similar dynamic path upward, comparable to 2004-2006. The bar on the far right hand side illustrates the continued upward pressure on deposit betas in the first quarter of 2019 since the Federal Reserve’s last rate hike in December 2018.
In summary, the jury is still out on the future path of monetary policy but, if we listen to what the markets and the Fed are telling us and take a lesson from history, we should expect to continue feeling the pressure of rising funding costs through 2019 and strategize accordingly.
Taylor Advisors’ Take:
You are not alone! Most depositories are facing pressures from customers for higher deposit rates and margins will likely continue to come under pressure given the flat/inverted yield curve and little relief from earning asset yields. Every depository is unique, with a distinct funding composition, market competition, wholesale funding sources and limits, and bank-specific liquidity and interest rate risk profiles. And as such, management teams should take these factors into consideration when developing tactical strategies to help control rising funding costs and defend against margin compression.
You have already subscribed to distributions. Thank you for your interest in our publications!